NACA-Report-1349

- Version
- 184 Downloads
- 1.54 MB File Size
- 1 File Count
- December 4, 2015 Create Date
- December 4, 2015 Last Updated
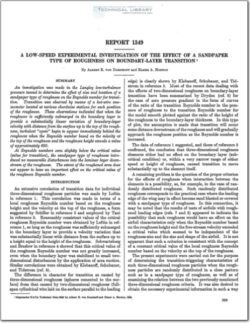
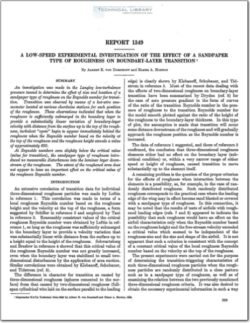
National Advisory Committee for Aeronautics, Report - A Low Speed Experimental Investigation of the Effect of a Sandpaper Type Roughness on Boundary-Layer Transition

An extensive correlation of transition data for individual
three—dimensional roughness particles was made by Loftin
in reference 1. This correlation was made in terms of a
local roughness Reynolds number based on the roughness
height and the velocity at the top of the roughness, a form
suggested by Schiller in reference 2 and employed by Tani
in reference 3. Reasonably consistent values of the critical
roughness Reynolds number were obtained by Loftin in ref—
erence 1, so long as the roughness was sufficiently submerged
in the boundary layer to provide’a velocity variation that
was substantially linear with distance from the surface up to
a height equal to the height of the roughness. Schwartzng
and Braslow in reference 4 showed that this critical value of
the roughness Reynolds number was not greatly increased,
even when the boundary layer was stabilized to small two-
dimensional disturbances by the application of area suction.
Similar correlations were obtained by Klebanofi, Schubauer,
and Tidstrom (ref. 5).
The difference in character for transition as caused by
three-dimensional roughness (spheres cemented to the sur-
face) from that caused by two-dimensional roughness (full-
span cylindrical wire laid on the surface parallel to the leading
edge) is clearly shown by Klebanoff, Schubauer, and Tid-
strom in reference 5. Most of the recent data dealing with
the effects of two-dimensional roughness on boundary-layer
transition have been summarized by Dryden (ref. 6) for
the case of zero pressure gradient in the form of curves
of the ratio of the transition Reynolds number in the pres-
ence of roughness to the transition Reynolds number for
the model smooth plotted against the ratio of the height of
the roughness to the boundary-layer thickness. In this type
of plot, the assumption is made that transition will occur
some distance downstream of the roughness and will gradually
approach the roughness position as the Reynolds number is
increased.
| File | Action |
|---|---|
| naca-report-1349.pdf | Download |

Comment On This Post